This is the first publication I have ever been a part of. I am second author on this paper, the first being my graduate student mentor. Over the Spring and Summer of 2018, which I was working on a research project for BU EPIC Robotics (read more about that here), I was approached and asked if I would like to be a part of this publication especially sense the work being done is similar to the project I was a part of. Naturally I said yes, finding out that this publication was to be submitted to a ISER, a huge robotics conference with many big names in the machine learning and robotics community. We found out that the paper was accepted and from there we had a couple months to complete it. Because my grad mentor was away for the summer, most of the paper fell to me. He would be doing most of the writing while I would be doing most of the experiment conduction, data analysis, and other hands-on activities.
Disclaimer: Due to copyright concerns, I am not sure how much about the paper I am allowed to share. Hence I will only focus on the work I have done and evade talking about the theory/finer details.
Disclaimer: Due to copyright concerns, I am not sure how much about the paper I am allowed to share. Hence I will only focus on the work I have done and evade talking about the theory/finer details.
|
Overview
The research that this publication tackles falls into the realm of computer vision, feature matching, and object matching. It presents a solution and experimental verification for the problem of object matching across an array of images. The proposed algorithm, QuickMatch, is reviewed as to how it works and then tested in an experimental case. This experiment is to demonstrate the power of QuickMatch by matching features across a number of images and comparing the speed, accuracy, and frequency of matches to that of standard techniques that exist (i.e. OpenCV matching algorithms such as Brute Force or Flann). The results of the experiment shows the advantages of QuickMatch for improving pre-existing algorithms as well as in other applications such as object discovery and localization. |
My Role
I played a huge role in the experimental part of this research. My grad mentor, the first author of the paper, created the script and I had to use that to perform an experiment that compared its performance to other object matchers as well as to show off an example of using the algorithm to localize the position of an object. This included performing the data analysis, collecting videos, and create visuals of the results. For all of this I employed the following:
I played a huge role in the experimental part of this research. My grad mentor, the first author of the paper, created the script and I had to use that to perform an experiment that compared its performance to other object matchers as well as to show off an example of using the algorithm to localize the position of an object. This included performing the data analysis, collecting videos, and create visuals of the results. For all of this I employed the following:
- Using the Linux operating system for all aspects of this project
- A very extensive use of Python in order to write scripts to process and analyze data
- Using the ROS framework in order to connect to and control robots and to gather data
- Instrumentation and experiment design
- Problem solving and finding elegant solutions
- Math and statistics for data processing
The Experiment
The experiment that I performed is as follows:
The experiment that I performed is as follows:
- The experiment will be performed in a motion capture room called the OptiTrack. This room is surrounded by infrared cameras that can track any objects location and orientation with respect to an origin point given that said object has a small spherical reflective ball on it.
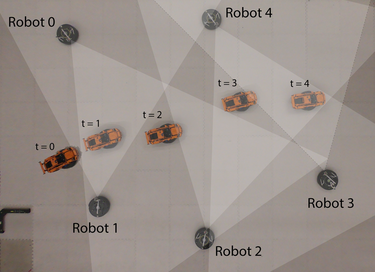
- A set of five camera mounted robots would be set up around the room. These cameras would remain stationary and placed in such a way that they form an aisle. Their orientation would be such that any points within the aisle they form is in view of at least one camera. The positions and orientations (pose) of each would be recorded using the OptiTrack equipment.
- A sixth drive-able robot would be placed outside of the aisle out of view of the cameras. An object, in this case a LEGO toy car, would be mounted on top of this robot.
- This robot would be driven through the aisle. As it drives, the cameras would take pictures at the same time every so often until the robot with the object on top reached the end of the aisle. During this time, the pose of this robot would be continuously recorded, thus tracking the trajectory of the robot.
- Once the robot makes it to the end, this concludes the experiment.
Preparing For The Experiment
Before I could go ahead and start the experiment, I had to do a couple things beforehand. Firstly, I checked to make sure that the five robots to be stationary had cameras attached to them, that they all worked, and that they were charged enough. Next I had to calibrate each of the cameras. This was a two step process. The first was to run a calibration that would save a calibration file for the cameras. This was easy, all I had to do was run a ROS package that would do all of the calibration for me. All I needed to do was hold up a check board at different distances and orientations in the camera until the calibration was complete. The package that I used can be found here. The next step was to run my own calibration in order to accurately determine the distance from the camera to an object. This was more involved; to do it I did the following for each camera:
Before I could go ahead and start the experiment, I had to do a couple things beforehand. Firstly, I checked to make sure that the five robots to be stationary had cameras attached to them, that they all worked, and that they were charged enough. Next I had to calibrate each of the cameras. This was a two step process. The first was to run a calibration that would save a calibration file for the cameras. This was easy, all I had to do was run a ROS package that would do all of the calibration for me. All I needed to do was hold up a check board at different distances and orientations in the camera until the calibration was complete. The package that I used can be found here. The next step was to run my own calibration in order to accurately determine the distance from the camera to an object. This was more involved; to do it I did the following for each camera:
- I placed the camera in a wide open area. On the ground in from of it, I marked with tape 7 locations at various distances from the front of the camera. I measured and recorded these distance.
- Using three objects, I places each at each of the seven locations and took a picture. Thus for each camera, I had 7 images of each object at different distances from the camera resulting in 21 images total per camera.
- With all of that data saved, I went to my computer. I made a csv file for each camera that contained the following data for each image: The object's name, the object's height in cm and pixels, the distance to the object in cm, and the image height in pixels.
- With these csv files, I wrote a scripts that would process the information in it. First, I used the object's height in cm and pixels, and the image height in pixels, I found the height ratio; this metric is the height of the object in cm that covers 1% of the image's height. This was done to correct for variations in the image's resolution and was calculated by: object height(cm)/(object height(px)/image height(px))
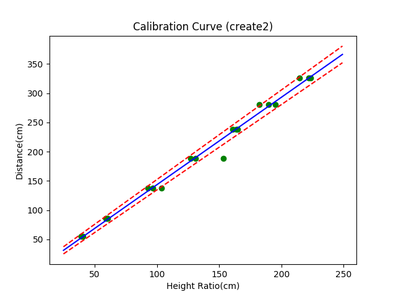
- Once I had this data, I plotted it against the distance in cm from the camera. The resulting relationship looked pretty linear as I had hoped, so I fitted a linear regression line to the data. This constituted my calibration curve for the camera, such as the one show. In the graph, the green dots are the data points, the blue line is the fit, and the red lines border the error region. I also saved the information of the fit to a csv file for later use.
- I found the filed of view of the camera I was using. Knowing this and the width of the image, I found the horizontal angle that each pixel covers.
- Then, given that I know the center coordinates of the object and image, I subtracted their two y values and multiplied it by the angle/pixel.
- The resulting value is the bearing of the object. With a bit of trigonometry, I could convert the distance (radius) and the bearing (angle) to an x and y displacement.
Experiment Setup and Execution
The next step was to run my experiment. This was a very involved process as the setup needed to be done properly without shortcuts less I dont get any of the data I need. Below are the steps I took to perform my experiment:
The next step was to run my experiment. This was a very involved process as the setup needed to be done properly without shortcuts less I dont get any of the data I need. Below are the steps I took to perform my experiment:
- In the OptiTrack motion capture room, I changes all of the foam tiles on the floor to white and cleaned up the room a bit to control for environmental effects. I did leave some objects in the room such that there is some noise in the room for the algorithms to try to handle.
- For all of the stationary robots, I places them in their correct positions, faced them all toward the back wall, and turned on their internal Raspberry Pi computers.
- For the robot that would be driver, I mounted the car on top of it and placed it randomly.
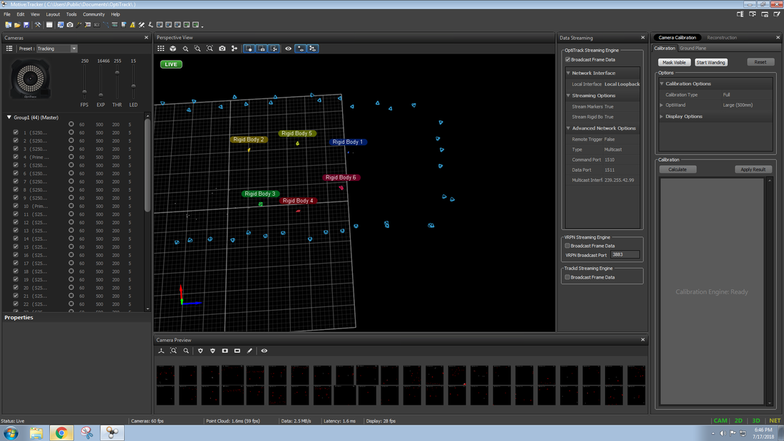
- I started up the motion capture system on one of the computers.
- I loaded the correct calibration file for the room and got to work identifying the robots. Each of the robots are indexed from 0 to 5 and had four reflective markers on them except for the driving robot; its markers were on the car instead. All I had to do is highlight the markers corresponding to the robots via the program and define them as a rigid body. This was done in order of the robot's index.
- Once this was completed, I then oriented the robots the way I needed them to be. From top down, the setup looked like the image shown earlier.
- I then moved over to the main computer. I started the motion capture node via ROS in order for the OptiTrack data to be streamed. I also wirelessly connected the main computer to all the internal Raspberry Pis of the robots.
- On the driving robot, I started the program that would enable me to drive it. Additionally, on the main computer I started the program that would connect my controller to the system. I checked that the controller was responding and that the robot drove when I moved the joystick.
- On each of the other robots, I started the cameras.
- I ran the script that would save the OptiTrack location data for the driving robot and manually recorded the location data for the other robots.
- Finally, I ran the script that would allow me to take a picture with all of the cameras simultaneously using the controller's trigger and save them into their corresponding folders.
Preparing for Data Analysis
I now had all of this data to process, but needed a fast, autonomous way to do it all. After a bit of brainstorming, I came up with a series of python scripts that would do everything I needed. Here was the basic idea:
I now had all of this data to process, but needed a fast, autonomous way to do it all. After a bit of brainstorming, I came up with a series of python scripts that would do everything I needed. Here was the basic idea:
- I had one "master" script that would control all of the data processing. At run time, the script would accept different parameters that would dictate how features were extracted, which matching algorithm to use, the threshold for identifying matching objects, and whether or not to record a video of the session. Additionally, the script would expect a value for the physical height of the object to be identified, an important thing to know when calculating the distance to the object.
- This script was optimized to only work with a set of data from one camera at a time. Once run, a two GUI windows will come up asking to specify the directory of images from the camera to be processed, the query images, and the directory of images of the object to be identified, the search images.
- For each search image, all of the query images would be compared against it. At this point, the master script offloads some of the work. Specifically, the master script sends the images to a "homography" script.
- This script first extracts key points and feature descriptors from each image based on the parameters set at run time. The script will utilize SIFT, SURF, or ORB to perform the feature extraction. This was yet again offloaded to another script simply for the ease of adjusting feature extraction parameters and iteration.
- Once the feature information was returned, the homography script would then pass this information to a matching script that would perform matches using the method set by the parameters at run time. The script will use the Brute-Force, Flann, or QuickMatch (our algorithm) to perform the feature matching across different images.
- With the matches returned from the matching script, the homography script will then perform homography; based an the threshold set at run time, the script will identify the region of the query image that most closely matches the search image. The resulting output is a collection of four lines that represent the border of the identified object. I also implemented a screening method where it checks if the four lines create something that resembles a box. If all of the internal angles of the resulting boundary are not within a certain range, the output is ignored.
- The script will either return the boundary lines or nothing depending on if an object is identified and if the boundary is a box-like shape.
- The homography script will send the homography results back to the master script, which will then interpret the boundary lines in order to extract the center of the boundary and the height of the box at the center. This information is sent to a script that will use it to calculate the distance to the camera:
- The distance calculation script will import the calibration data for the camera that took the images being studied. This calibration is the linear relationship that was found during the calibration process explained earlier. The script will then proceed to take the data passed to it in order to calculate the x and y distance from the camera, along with the error of the measurements.
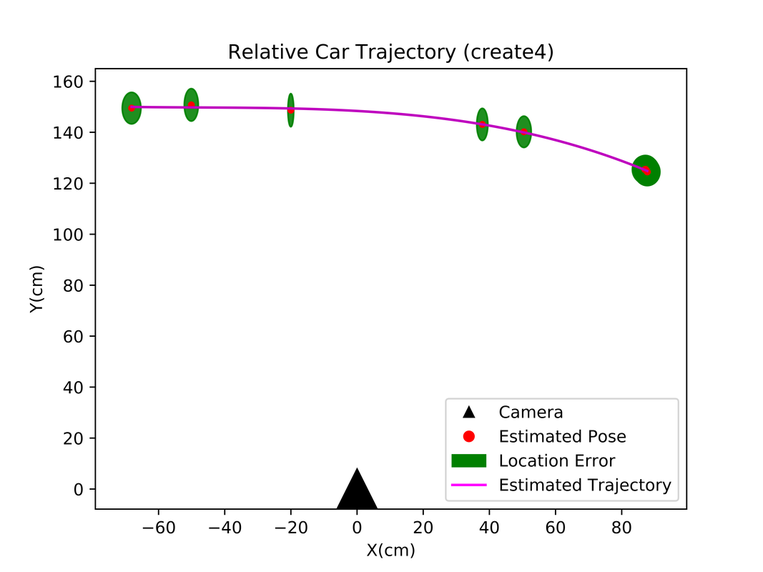
- The master script takes the results from the calculator and adds it to an array. Because each query image is being compared to multiple search images, one query image may have multiple results. These results are simply averaged together such that each query image has a single estimation of how close the object is to the camera if one is detected at all. All of this data is saved to a file as a .csv for later use. Additionally, the results are plotted on a plot that shows the relative trajectory of the object with respect to the object. This plot is shown below as well as a video of the real time data processing that led to the plot.
|
|
|
This data processing was run for each of the cameras I used, in total five. This resulted in five files each with information of where the object was detected with respect to the camera used to image it. The final steps were to compared the localization to the actual trajectory of the car.
- During the experiment, information about the angle and coordinates of the cameras in the arena was recorded as well as the trajectory of the object as it moved in the arena.
- For each camera's localization data, the results were adjusted such that they took into account the angle and position of the cameras in the room.
- Further, any data points that were close together were averaged together as they represent the fact that two cameras saw the object in the same place. The definition of "close" was determined by a threshold that could be manually changed.
- Once the localization data for each camera was adjusted to the arena as the ground frame, the plot could be generated. All experimental points of object's location were plotted on top of the actual location of the object recorded. The camera locations were also plotted to show where they were in the arena. The resulting plots look like the one below (NOTE: this plot was generated using a car as the object with data processing using SIFT features and the QuickMatch matching algorithm).
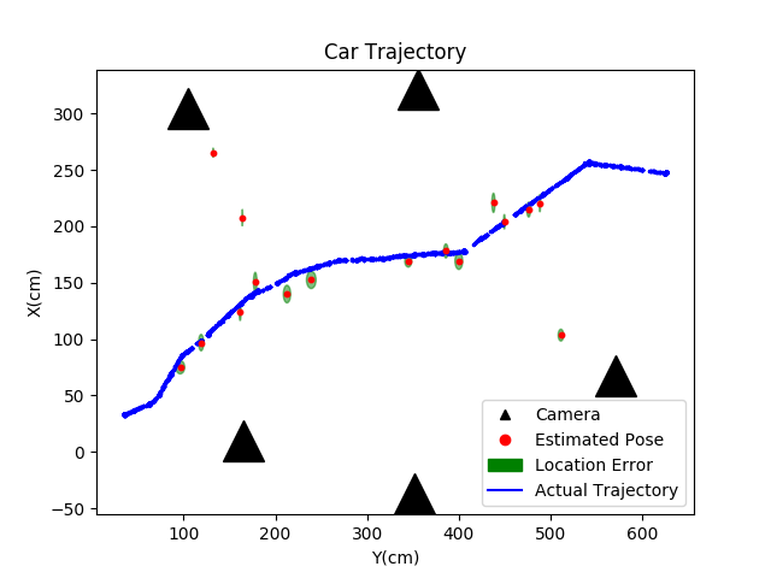
SIFT and QuickMatch
Interpreting the Results
Looking at the Car Trajectory plot, the results are very encouraging. The localization data matches very closely to the actual trajectory of the object! This is especially exciting because this plot was generated with our algorithm. I compared this result to the Brute-Force and Flann matching algorithms with similar parameters and got the following results:
Looking at the Car Trajectory plot, the results are very encouraging. The localization data matches very closely to the actual trajectory of the object! This is especially exciting because this plot was generated with our algorithm. I compared this result to the Brute-Force and Flann matching algorithms with similar parameters and got the following results:
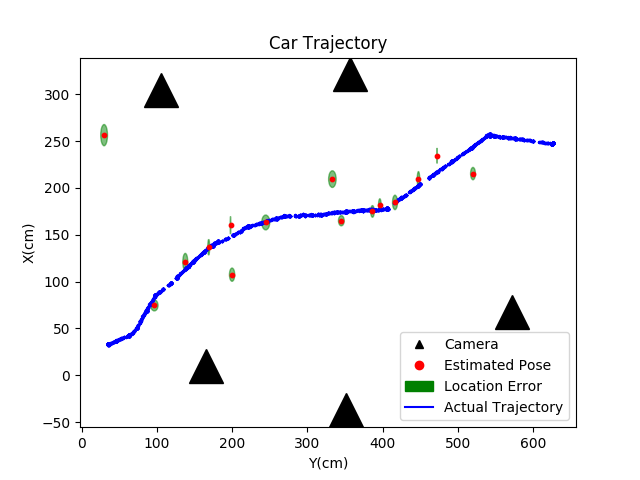
SIFT and Brute-Force
|
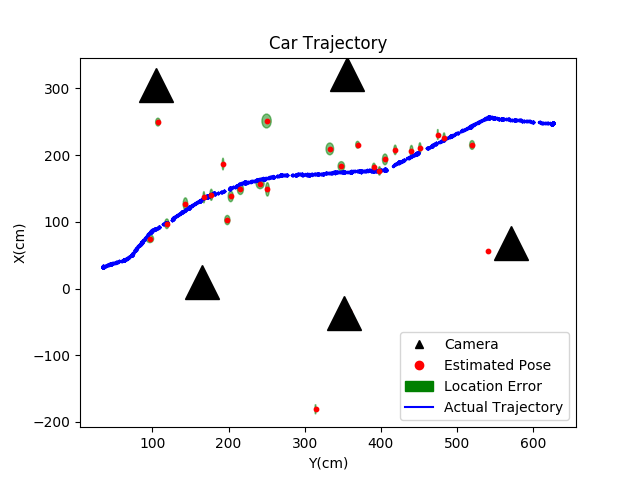
SIFT and FLANN
|
Needless to say, the QuickMatch algorithm seems to be the most precise. A majority of the points lie within the actual trajectory and outliers are minimal. Not only does this show off that my data analysis scripts worked, but it also cleanly outlines the power of this matching algorithm. These results will be seen in the publication.
Struggles and Take-Aways
Through this process, I encountered many set-backs and had to troubleshoot many problems. On the software side, I spent a lot of time simply figuring out how to get started on my data analysis scripts. Once I got started, I had to test many different variations of it to ensure that it did what I needed it to do, that it was accurate, and would work in all cases. This involved saving many drafts before I made big changes and rearranging my code to optimize it.
On the hardware side I had separate but equally frustrating problems. I had to perform my experiment four times in total. The first two times we ran into a potential copyright issue because of a logo that was on the car we were using as the object. The third time, two of the cameras had an issue that was not noticed until after the experiment was completed. Further, during that experiment I had forgotten to record the angles of the cameras which prevented me from getting the final plot accurately. By the fourth time, I got it right.
Despite the many struggles and time spent on this, I feel like this was a wonderful experience. Not only did I get a taste of what its like to run an experiment and data analysis of my own design, I was able to contribute to a publication that will be submitted to a huge robotics conference. I was able to put to use many different skills such as instrumentation, coding, problem solving, and analysis techniques which I otherwise would not have been able to use and appreciate fully. My name on a paper for the first time is easily one of the coolest things I have been able to do during my time in university and it was an experience that I will not soon forget.
