|
Project Goals: The main objective was to create a Truss out of straws and foam blocks that could withstand a maximum load while being cost effective. A set of base requirements had to be met in order to consider the truss to be successful. This was completed in a group.
Learning Objectives: Throughout the completion of this project, I was introduced to many tools and practices that are used in in real life situations where something needs to be engineering and optimized. The skills I employed are as follows:
|
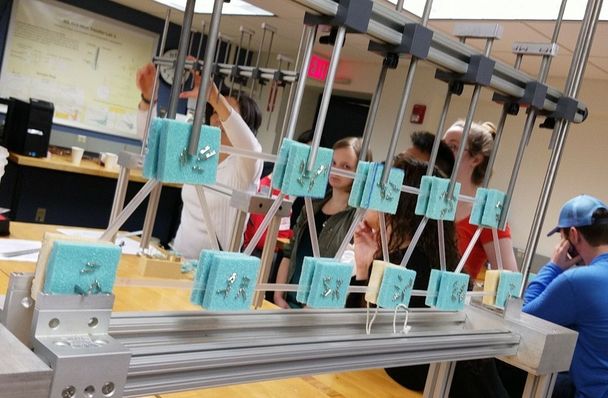
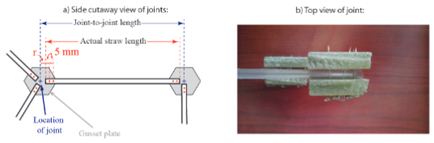 An image on how joints are to be assembled.
- The truss must be a single, upright, planar, simple truss. No truss member may be designed to extend below the line connecting the two end joints.
- You must use only the materials provided (i.e. straws, foam blocks, and metal pins)
- Members must be joined concurrently at joints using the provided pins and double pinned to the
guest plates as described below. There must be a gusset plate on each side of the joint. - Gusset plates may be any geometry but must have an area of less than 16 cm^2 with no straw extending along the gusset plate by more than 2.5 cm from the point of concurrency.
- All joint-to-joint distances must be at least 10 cm and no longer than 15cm.
- The truss must span a distance of 56.5 cm ± 1 cm.
- The truss must support for 60 seconds a minimum load of 4.91 N (that is, a 500 g mass) placed on a joint located 22 cm ± 0.5 cm measured from the pin-jointed end along a line connecting the two end joints.
- The unloaded truss must not sag more than 2 cm below a line connecting the end joints.
- The loaded truss must not have any member sag more than 6 cm below the end joint.
- The total (virtual) cost of the truss must be less than $350.
The success of a structure depends on the materials that comprise it. The maximum load a material can withstand is dependent on factors such as the elastic modulus and yield strength, which are intrinsic properties of a material. These values are derived from testing the performance of a material under certain axial loads until it breaks. These types of tests are formally known as tensile tests. Tests like these are performed because it is essential to understand the properties of the materials being worked with. These properties will dictate how a structure performs and further will give the engineer a general sense of how much stress said structure can bear before it fails.
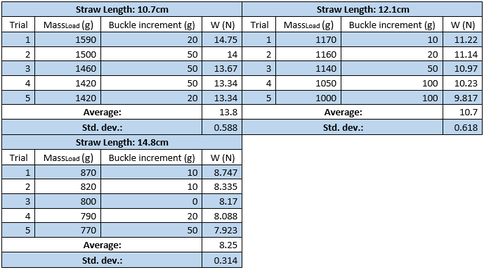
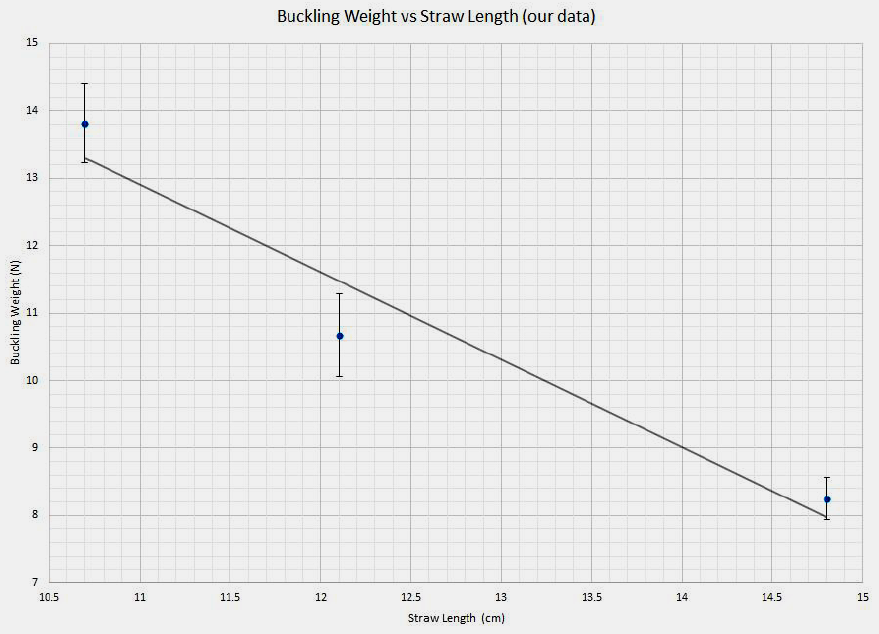
The overall goal of the truss project is to design and build a truss made of straws that can withstand a large load before it fails. In a properly built truss, most, if not all of the load is carried by the straws. To get an idea of how the overall truss will perform, it is essential to understand the strength of the straws. Straws of different lengths were loaded with increasing weights, putting them under compression, until the straws buckled. After enough data was collected, a relationship was fitted that graphed the maximum weigh a straw could hold as a function of the length.
|
|
Before any designs could be considered, a Matlab code was created that could simulate different designs in order to yield data on their performance. I was not part of the team that wrote this script, rather I was the one that did the hand calculations in order to verify the accuracy of the results. In order to do this, a sample truss was used. First, an analysis was done by hand in order to calculate the forces on all of the members in the structure. Then, once the code was written, the same calculations were performed by the Matlab script. The simulation was verified to be valid based on is the simulation results matched the hand results. Once this was verified, designs could start being tested.
Two designs were considered. After simulations were ran, we determined which design was better. The decision was based on the maximum load the truss could carry and the load to cost ratio.
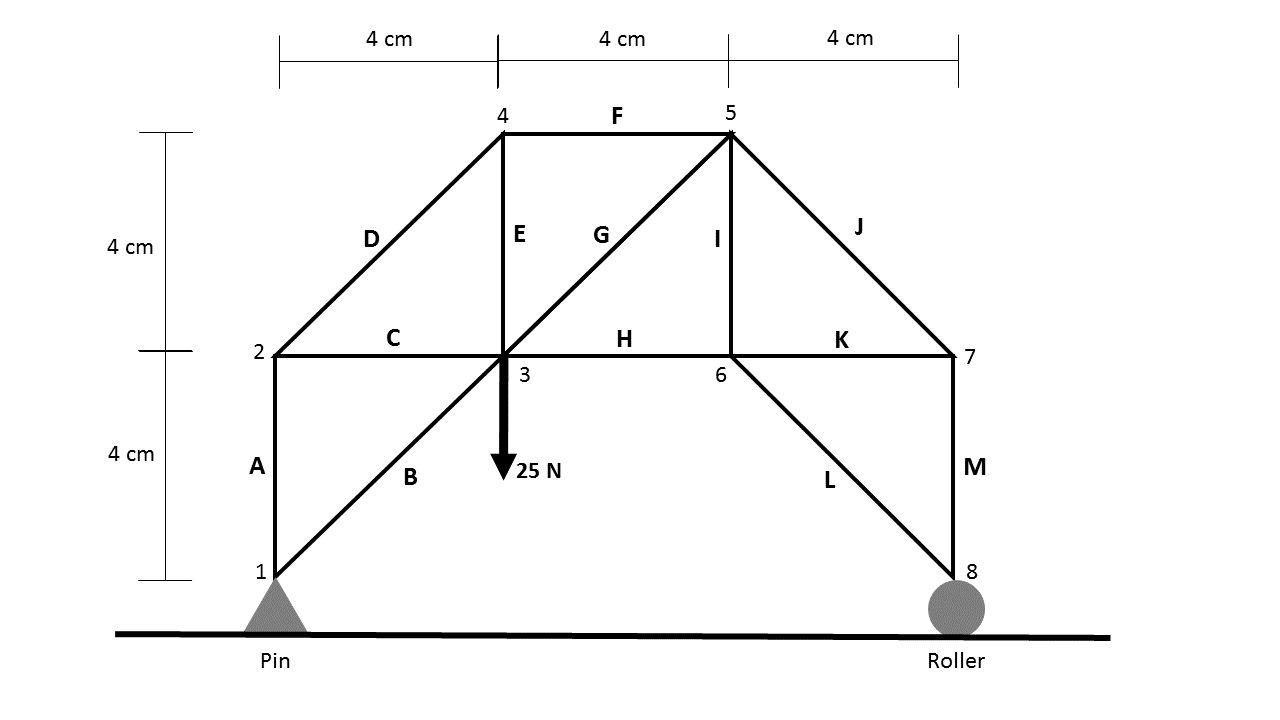
The model truss used to validate the Matlab simulation script.
|
|
Table 1 - Truss Simulation Output
|
Member |
Actual Length (cm) |
Joint-to-Joint Length (cm) |
Force Theoretical (N) |
State |
Force Actual (N) |
|
A |
11.5 |
11.7 |
6.979 |
T |
|
|
B |
12.2 |
12.4 |
3.785 |
C |
3.84704918 |
|
C |
11.4 |
11.6 |
6.914 |
C |
7.035298246 |
|
D |
11.3 |
11.5 |
7.395 |
T |
|
|
E |
11.1 |
11.3 |
6.7 |
T |
|
|
F |
10.2 |
10.4 |
10.608 |
C |
10.816 |
|
G |
10.9 |
11.1 |
6.588 |
C |
6.708880734 |
|
H |
10.2 |
10.4 |
13.579 |
T |
|
|
I |
11.1 |
11.3 |
4.467 |
C |
4.547486486 |
|
J |
10.2 |
10.4 |
11.437 |
C |
11.6612549 |
|
K |
10.9 |
11.1 |
4.329 |
T |
|
|
L |
10.7 |
10.9 |
9.456 |
T |
|
|
M |
11.3 |
11.5 |
4.567 |
C |
4.647831858 |
|
N |
11.2 |
11.4 |
7.113 |
C |
7.240017857 |
|
O |
11.1 |
11.3 |
4.487 |
T |
|
|
P |
11.7 |
11.9 |
4.93 |
T |
|
|
Q |
11.6 |
11.8 |
4.674 |
C |
4.754586207 |
|
R |
12.2 |
12.4 |
2.384 |
C |
2.423081967 |
|
S |
11.4 |
11.6 |
4.588 |
T |
|
Table 2- Maximum Buckling Load for Members Under
Compression
|
Table 3 - Critical Data
|
Optimization
The final design we choose underwent a bit of optimization before it was built. Before, the maximum theoretical load that could be supported in the was 9.32N. Even though this was above the required load bearing of the truss, on further discussion it was realized that this design could be further be optimized to accommodate greater load bearing. After substantial brainstorming and reevaluation of the design a conclusion was reached that the members nearest to joint 5 should be the shortest in order to bear maximum load. This design optimization increased the theoretical load bearing of the truss from 9.32N to 10.67N.
|
Construction
When the truss construction was planned it was decided that all materials – straws and gusset plates – will first be cut to determined dimensions, and subsequently assembled using a to-scale blueprint of the truss design. Once all the materials were prepared, it was assembled from the middle outwards. Care was taken not to puncture the foam plates multiple times and that the pins were positioned parallel to each other when it was pierced through the straws. An improvised pinning jig was made to accurately pin the straws to reduce the error factor during construction. To not increase our overall truss size, the straws were pinned with approximately 1-2mm apart on each plate. This helped efficiently design and build the truss with little wastage of material and time. During construction of the joint, the straws were oriented on the back plate, and sandwiched with a front plate that contained the design pattern for easy pinning, reducing the chances of error. |
|
The truss was tested and the maximum load it could handle exceeded the expected load by around 300g. However, while we had guessed that member J would fail first, it was actually member H that failed.
The truss was able to support more than its theoretical maximum load. This could be in part due to the fact that the simulation was of an idealized system where imperfections do not exist. Both uncertainty and human error had a major role to play on the actual performance of the truss. During estimation of the load that the truss can bear, it was kept in mind that the joint to joint distance provides an under-estimated load as the virtual length is greater than that of the straws used. In our construction we were careful to keep the joint to joint length as close to the actual straw length to reduce the error margin of the load bearing ability of the truss. While there is no for sure way to guarantee the maximum load that the truss can sustain (variables such as straw impurities, straw deformations that resulted from pinning, and pre-stresses from handling the straws are unaccounted for), it was safe to say that the truss would meet the requirements and be able to exceed this requirement without collapsing, leave a margin of safety.
That being said, when determining which member would fail first, the incorrect member was chosen. Through this failure we learned a very important lesson: always check the results of a simulation. We blindly trusted the simulation without verifying the results via hand calculations. This would have shown that there was a flaw in the script that was used; one test was not enough to determine is the script was valid. This is something to keep in mind moving forward, double checking is always worth the time and effort. This is a lesson that I am sure to not forget and this failure will make me a better engineer.
